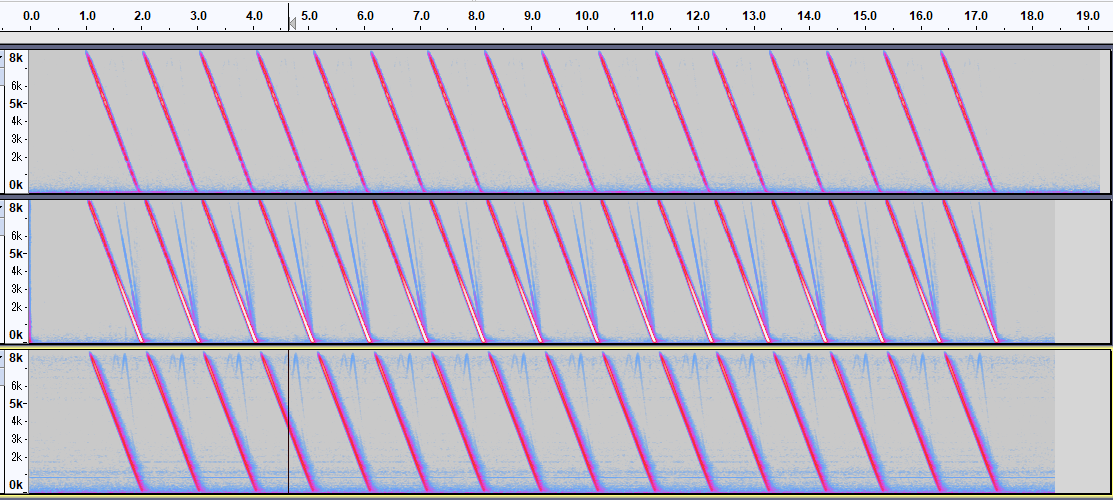
I prepared three TSP files recorded at different locations with different microphone arrays. The figure below shows an excerpt of one channel, which you open in Audacity to see the spectrogram.
In the two examples below you will see frequency components other than the original TSP signal. This is due to harmonics or reflected waves. It would be desirable to set the largest volume without such extra information.
The following three examples are TSP files that function without any problems in performance. In other words, it is the limit value of the volume that harmonics and reflected waves are barely visible as shown below. Be careful not to make the line due to harmonics or reflected waves more strongly than that. It is most desirable to adjust to the invisible state as in the example at the top.
